First Published October 2023 | Updated October 2026
Professional Women's Drill Size Tool & GPS Metrics,
Possession, Rondo's Squares & Drills Return to Competition (RTC)
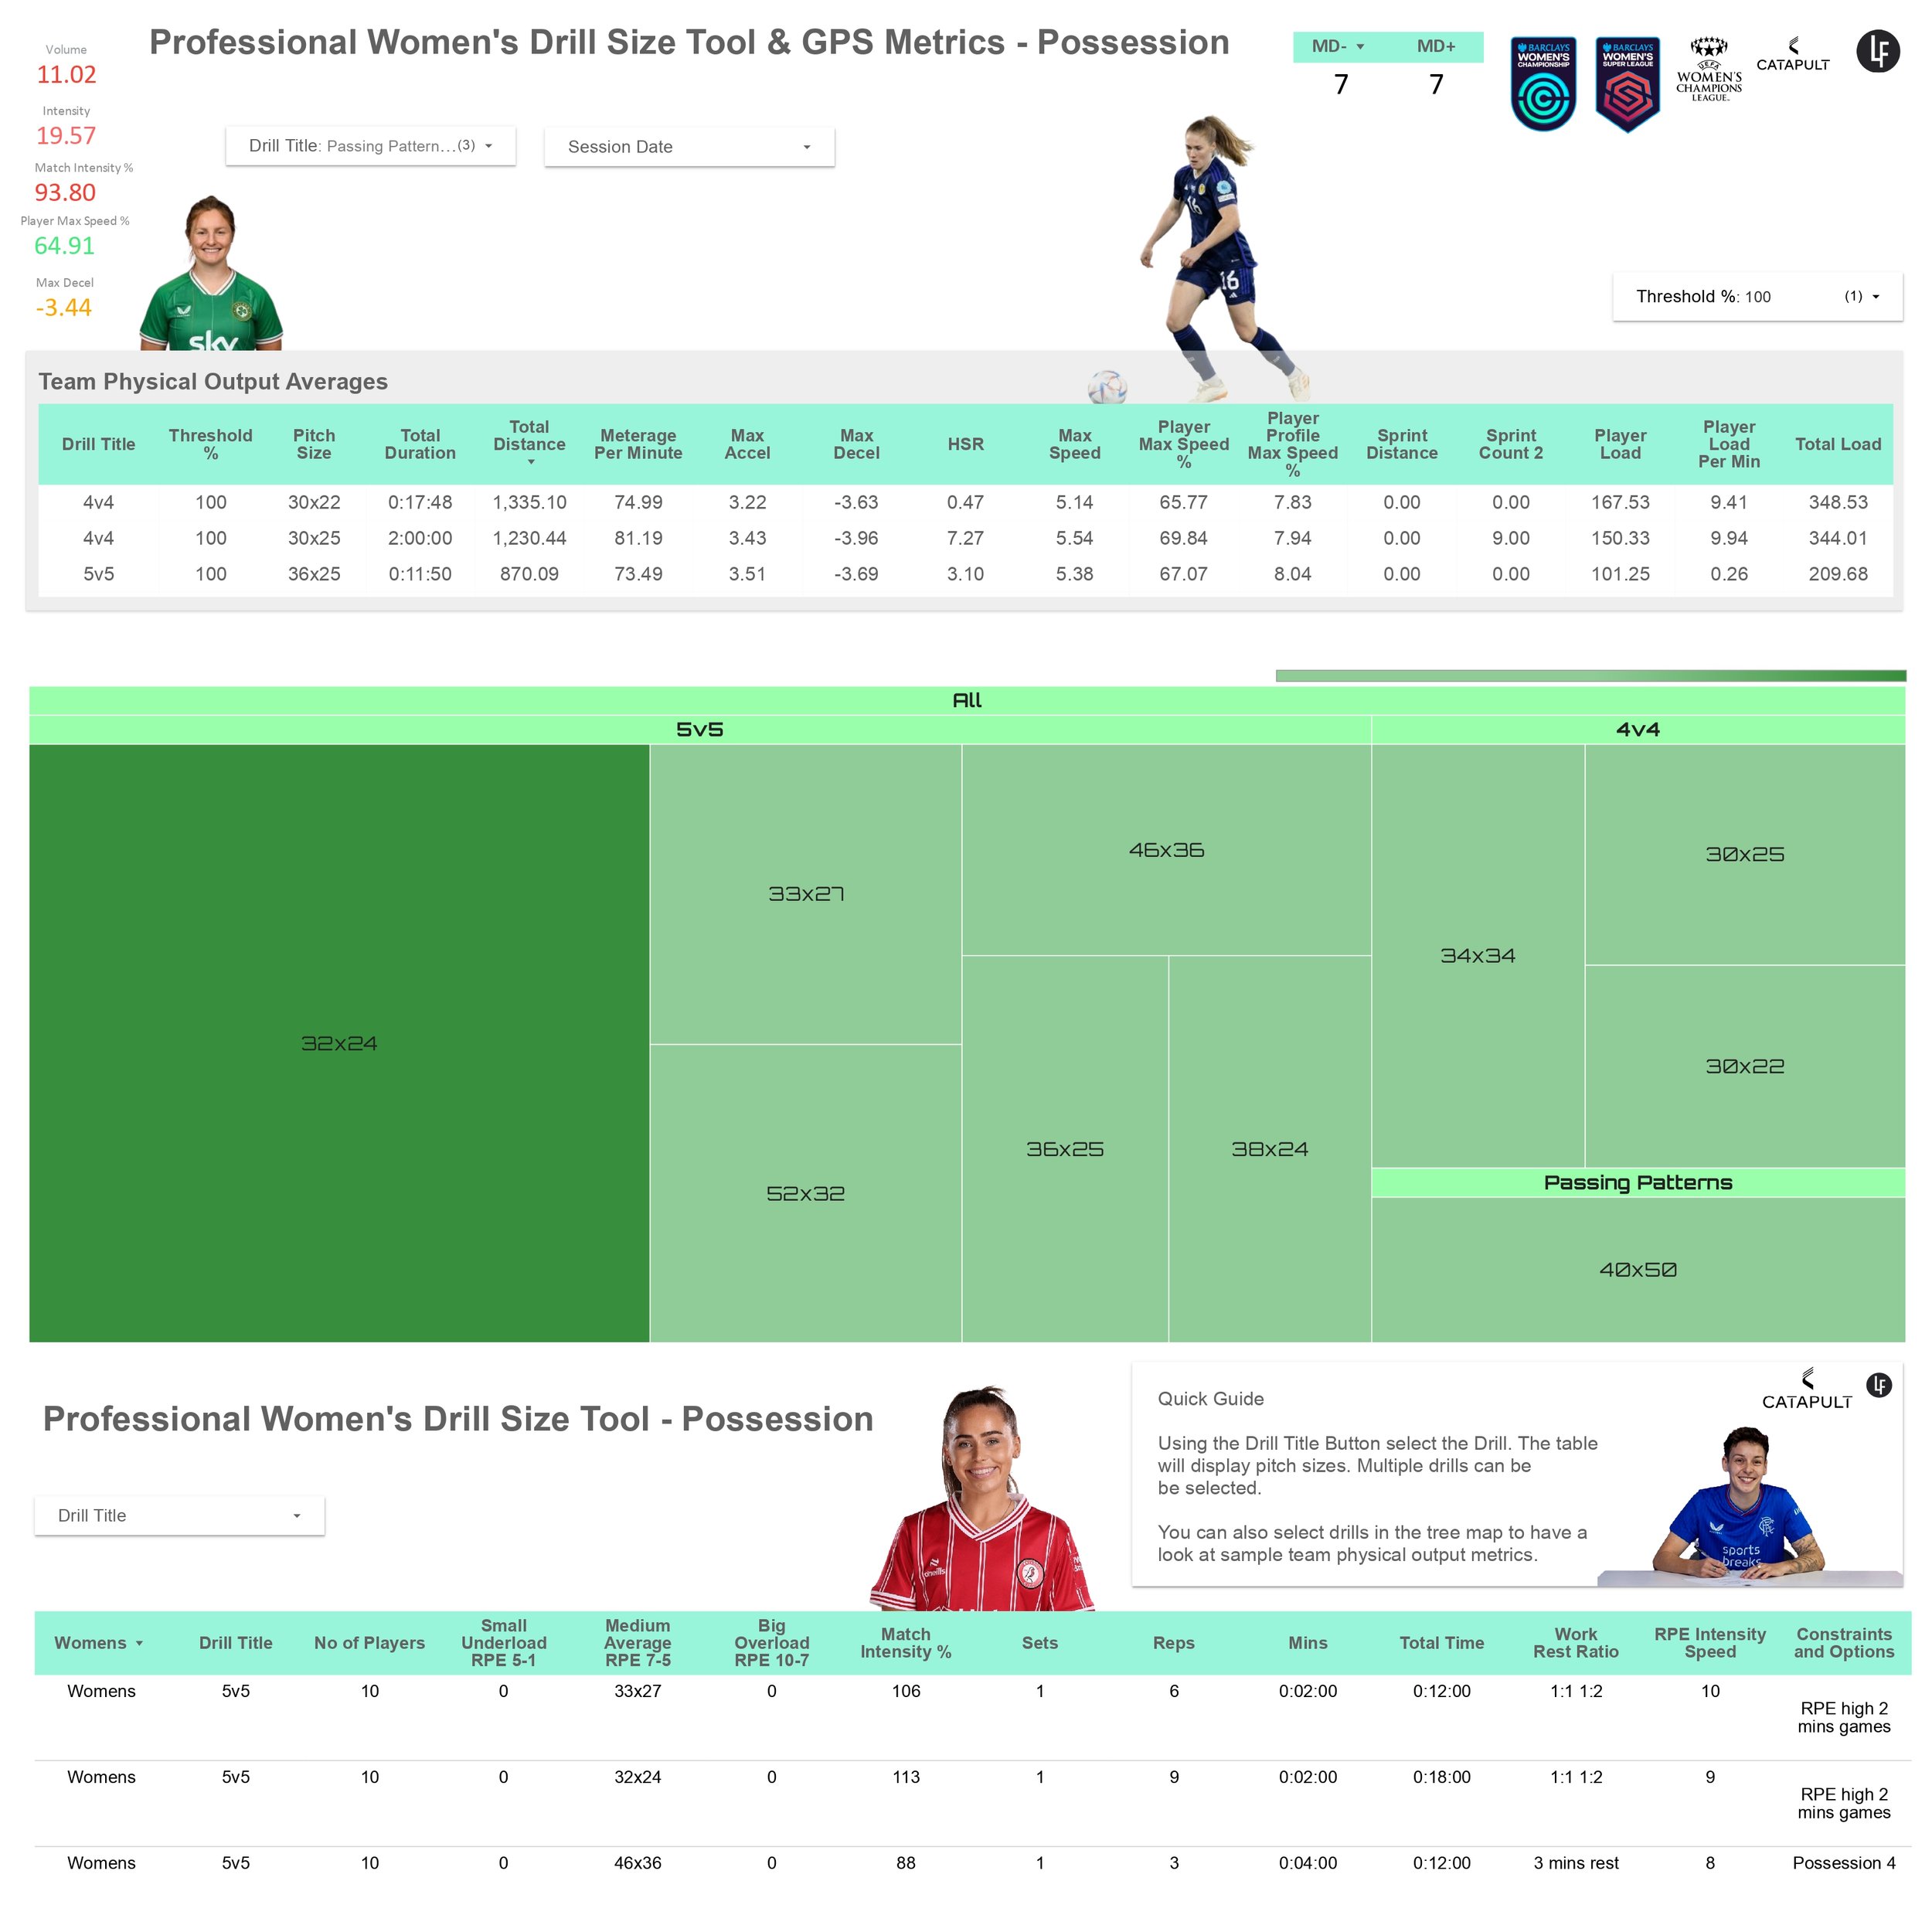
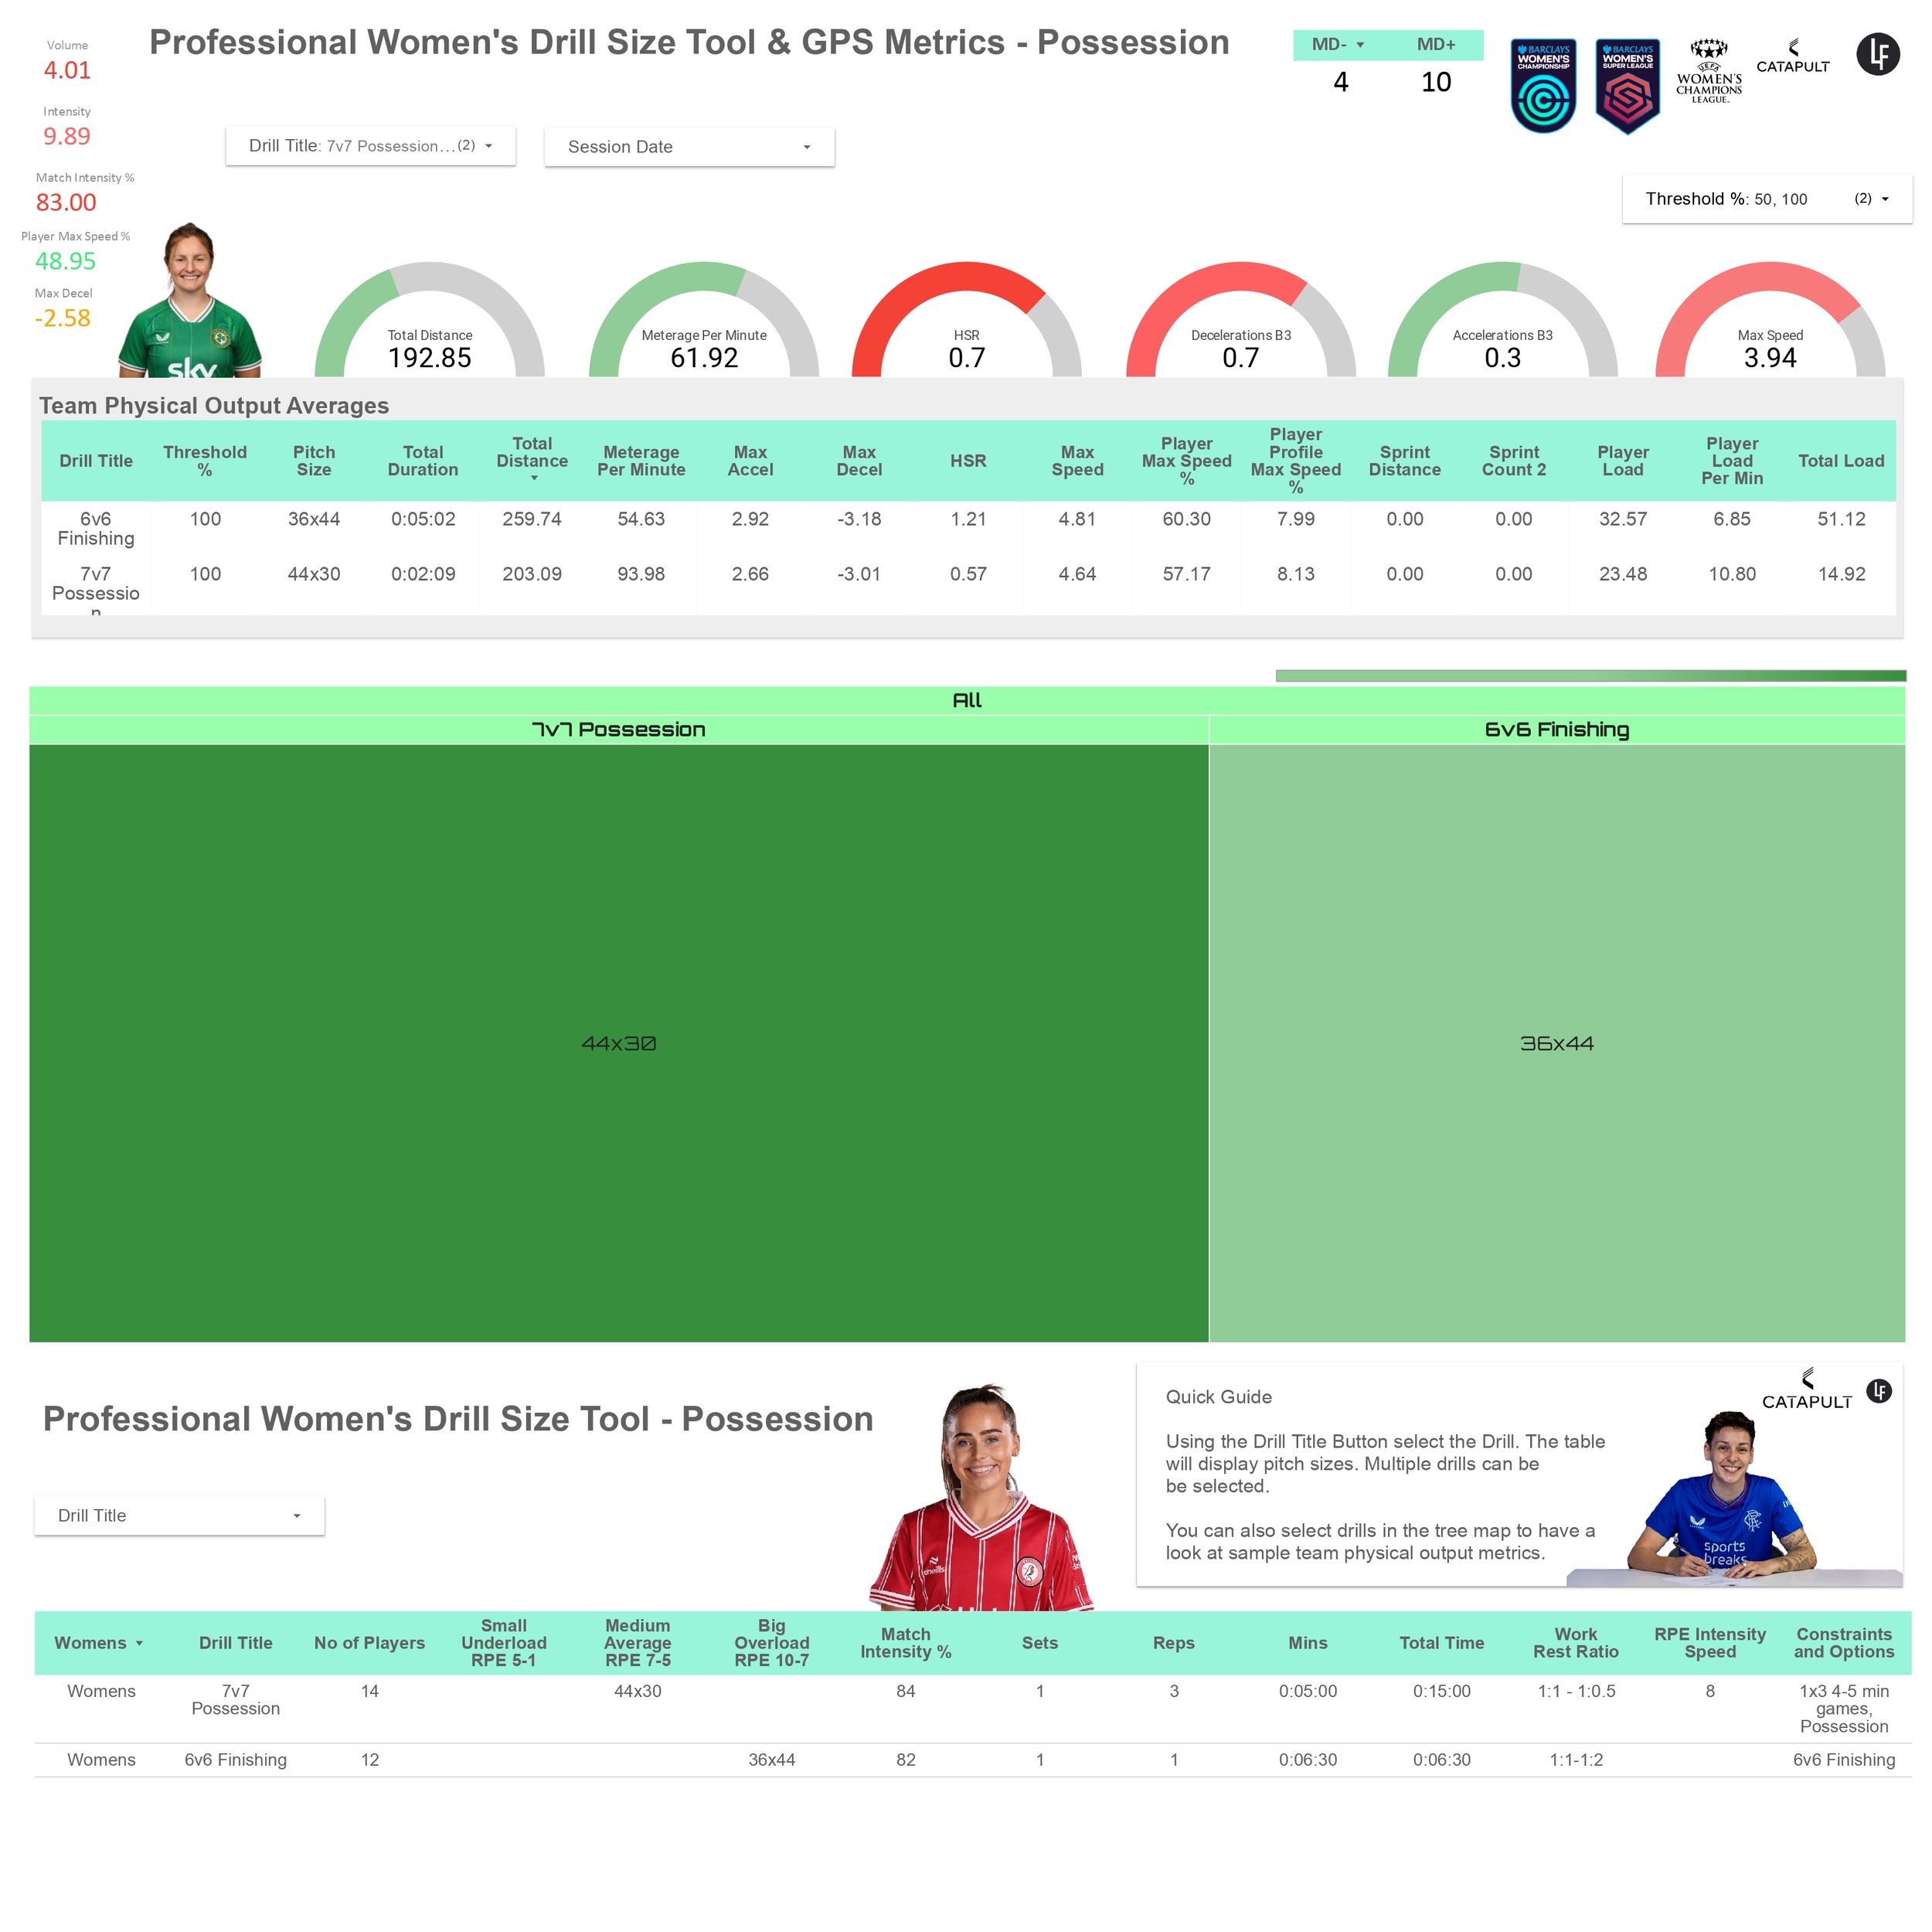
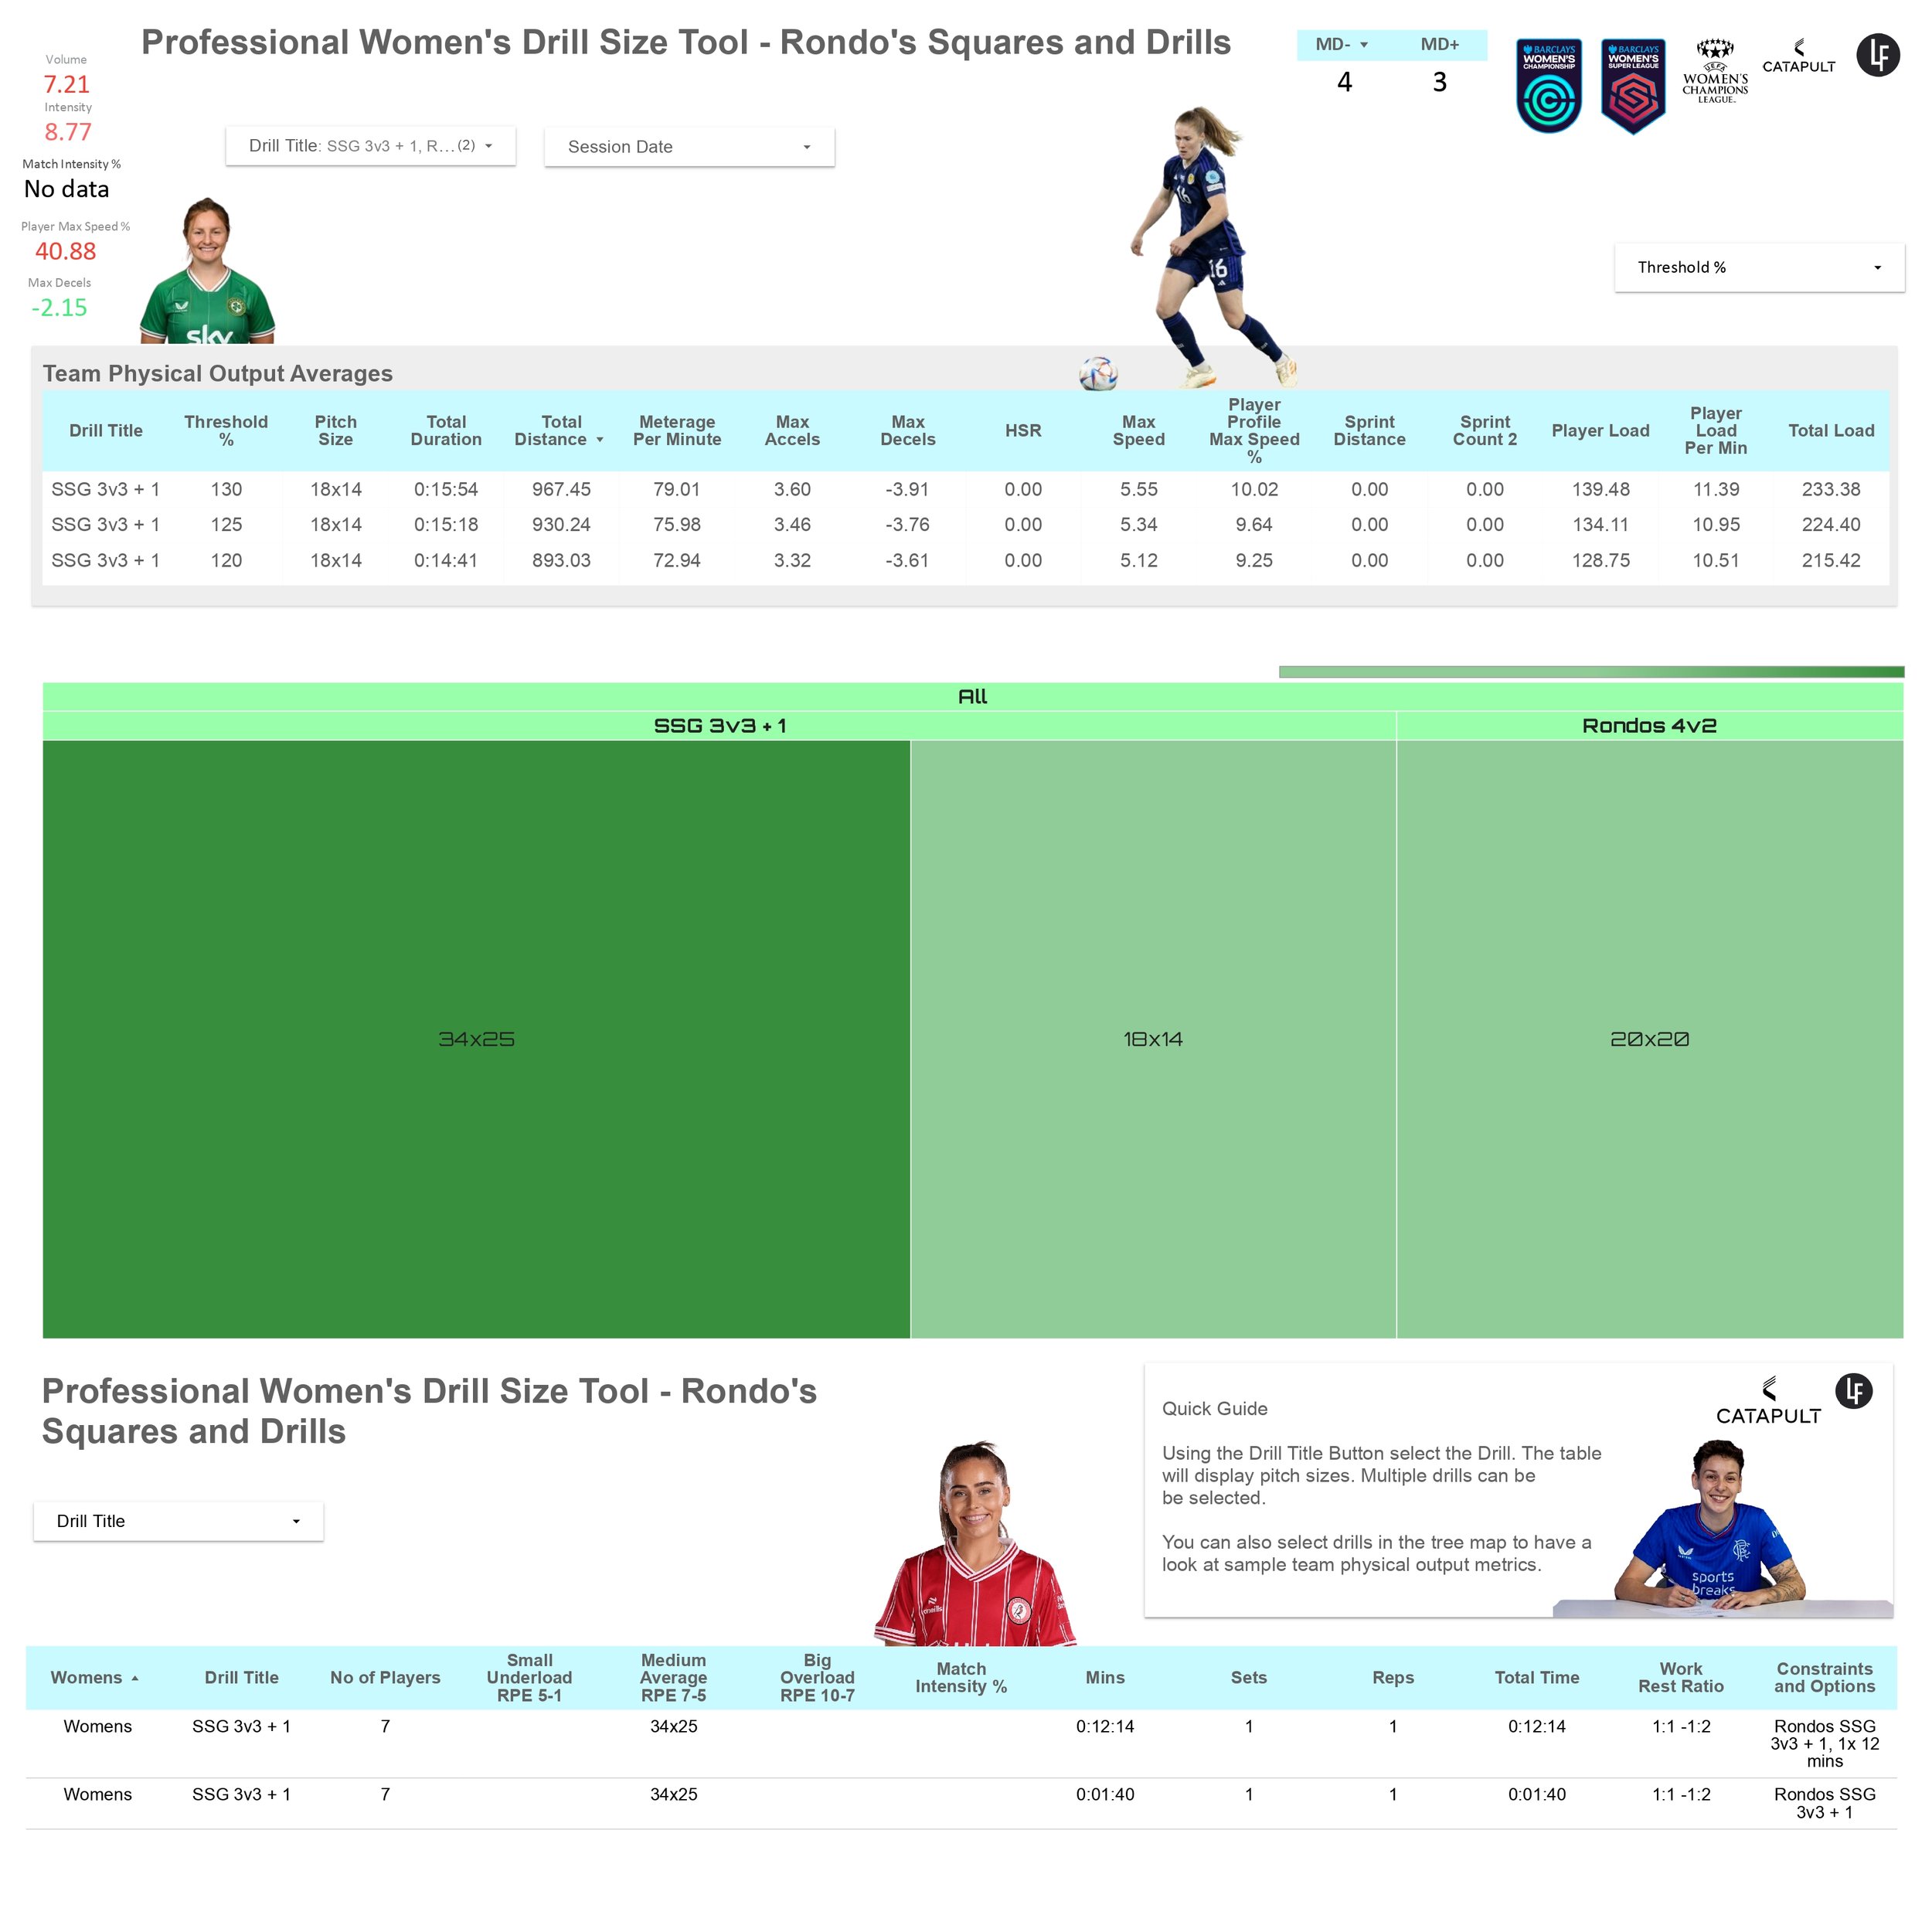
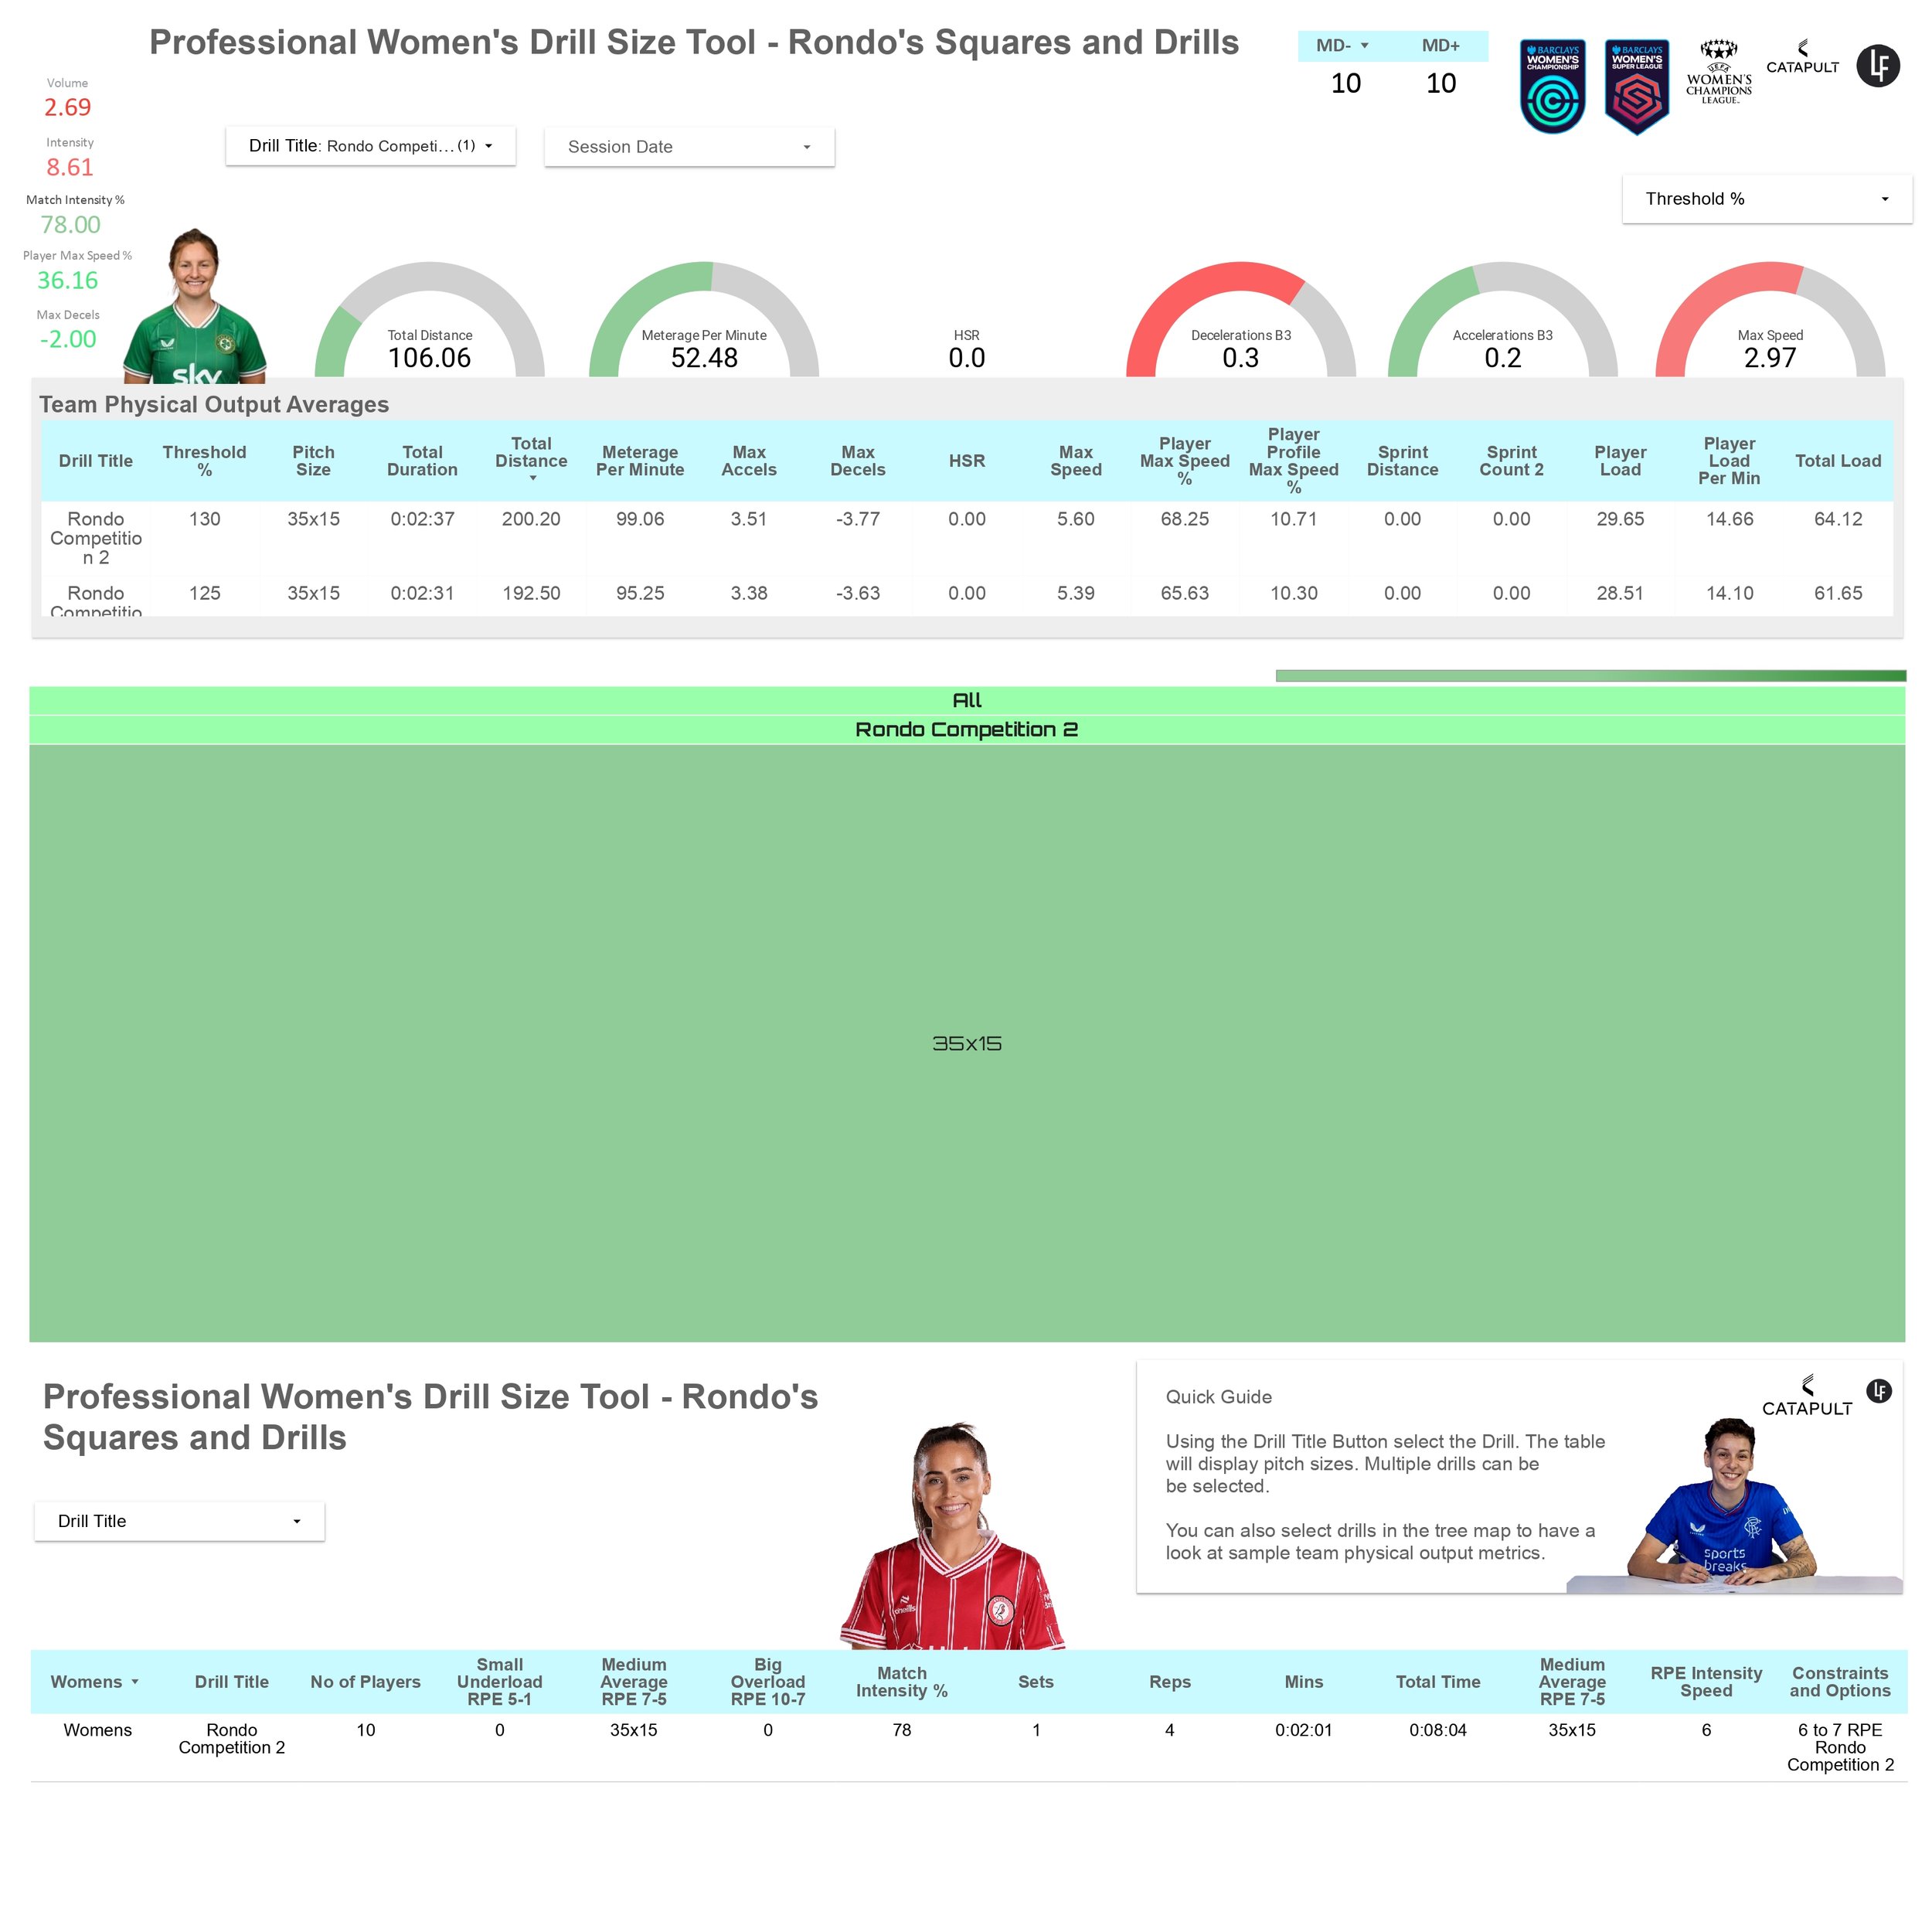
Using drill and match threshold percentages are great for rehab and Return to Competition (RTC) processes. For example, a player completes 30% of a full session, this can be quantified, and the appropriate drills or parts of a session selected.
The second table (not tree map) includes example internal (RPE) and external loads, with big, medium and small overloads. Examples are for Rondo’s, Squares and Possession, small, medium and large. This also includes other session drills and 11v11 and 8v8 internal matches.
I have taken the intensity metric for each drill and compared it to match intensity, this is shown as a percentage.
Match intensity changes from the first half of the season to the second half. Therefore, match intensity reflects these changes. A separate team selection tool, match data and reports will be available on my blog and social channels later.
This will include home and away match metric comparisons, opposition comparisons, and first and second half of the season intensity and other performance metrics.
All training sessions can be split into a total number of minutes, and the percentage of total time across weeks and months. Coaches then have a training overview of how much time is spent in each training drill category. For example, Rondo’s, Squares, Big Possession and Small Possession.
This can also be broken down into Low Duration, Medium Duration and High Duration.
This Dashboard is live so it can be continuously updated and modified. I hope you will find this tool useful. Google Data Studio looks great on mobile, giving coaches and players easy access on the go.
Looker can integrate into most programmes. This Google Data Studio dashboard is created using Google Sheets.
🔴 Match Intensity > 80% =
Red
🟢 Match Intensity < 80% =
Green
🟢 Player Max Speed % > 89% =
Green
(90% Speed Threshold)
🔴 Player Max Speed % < 65% =
Red
🔴 Deceleration Speed % > 4.5 =
Red
🟠 Deceleration Speed % < 4.5 =
Orange
⚡ Accelerations HI (Absolute): 2.5 m/s²
⚡ Decelerations HI (Absolute): -2.5 m/s²
⚡ Accelerations HI (Relative): 3.2 m/s²
⚡ Decelerations HI (Relative): -4.1 m/s²
Acceleration is influenced by initial acceleration speed and has been shown to influence acceleration capacity.
Deceleration is less dependent on initial speed. Therefore, definitions for deceleration require different calibration thresholds than those applied to acceleration.
Relative Thresholds (Football)
🔴 High Intensity = > 75% of Maximum
🟠 Moderate Intensity = 50% to 75% of Maximum
🟢 Low Intensity = 0% to 50% of Maximum
Source: Filippo Baldasso, Catapult. Relative acceleration and deceleration thresholds adapted from football-specific monitoring frameworks.
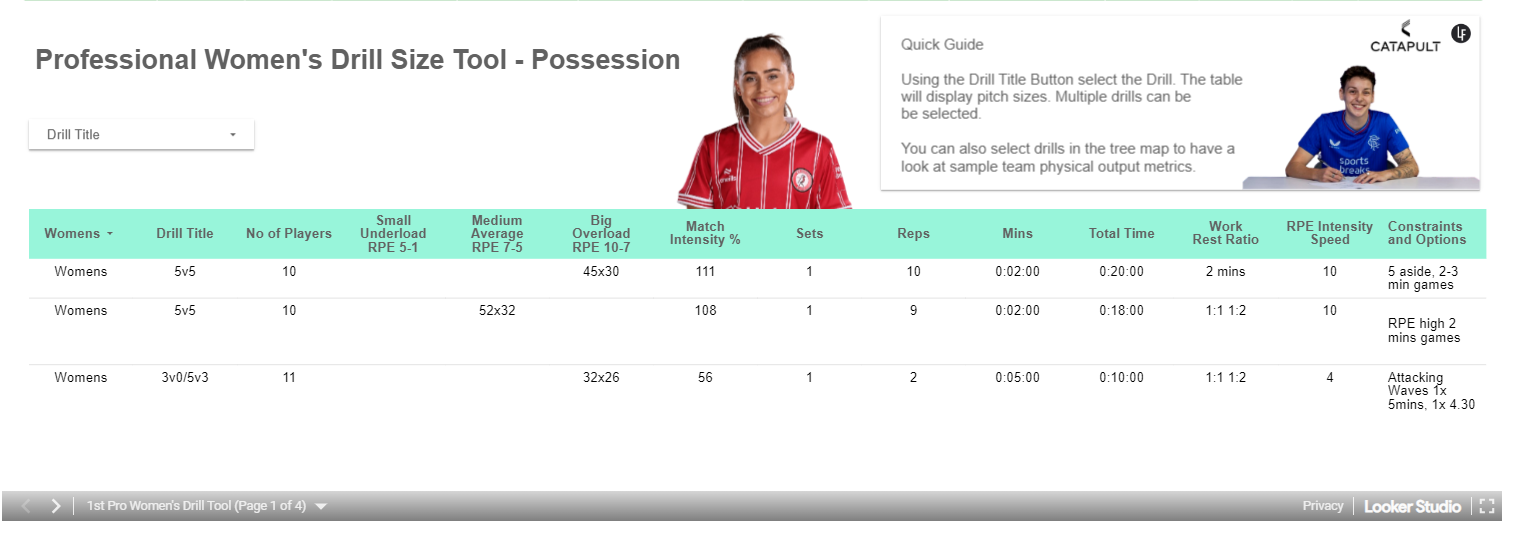
Live Dashboard
Sample PDF Report Views